
Helm-Deltapoll Conservative Voter Monitor / Wave 1
The full tables for this survey can be accessed here
1. Background
In 2019 the Conservatives under Boris Johnson received nearly 14 million votes, and for the first time since 1955 the number of Tories was greater than the number of Labour and Liberal (Democrats) combined. It was the culmination of six successive general elections in which the Tories had increased their share of the vote. Had Johnson and his successors been able to sustain that coalition of support, and the gains he and his predecessors David Cameron and Theresa May had made among previous Labour voters and in former Labour heartlands, the long-term electoral landscape could have been transformed.
Instead that coalition lies fractured, with the Conservative share of the vote below 30% in the polls since September 2022 validated by a string of record-breaking by-election and local elections defeats. With very few other realistic sources of new votes, to remain in government - or even just to prevent Labour’s winning an overall majority - the Tories’ 2019 coalition must be rebuilt.
2. The Helm-Deltapoll Panel
The Helm-Deltapoll Panel seeks to identify and understand the views and motivations of those voters and how they may develop over the next few months.
It is made up of a representative sample of 1,500 respondents who voted Conservative in 2019 who will be surveyed periodically on their attitudes to the government and Rishi Sunak, to the prospects of a Labour government under Keir Starmer, and the dynamics which will help them to make up their minds which party to vote for in the general election.
The panel project was devised by Greg Cook, Labour’s Head of Political Strategy and Polling between 1995 and 2019, with colleagues from Helm Partners Ltd, a strategy consultancy established in 2022 by Patrick Foster, a former journalist, and Declan McHugh, a former Labour special adviser.
Fieldwork for the first wave of the survey was carried out by Deltapoll between 9 and 14 February 2024.
3. The Electoral Challenge
The key starting point for any assessment of the next general election is the outcome of the last one. With that in mind, in order to become the largest party in parliament Labour needs to make a net 88 gains from the Conservatives (on the new parliamentary boundaries) compared with 2019. The 88th most winnable Conservative seat (Shrewsbury) has a Tory majority of 17.9% and therefore Labour needs a swing of 9% to win it.
In order to win an overall majority of two Labour requires 127 net gains from all other parties. If there were no net swing from the Scottish National Party to Labour then those gains would almost all have to be made from the Conservatives, and the 127th most winnable Conservative seat for Labour (Plymouth Moor View) has a Conservative majority of 27.4%, requiring a swing to Labour of 13.8% for it to be lost. That required swing from the Tories falls to 10.8% if Labour were to achieve an equivalent swing from the SNP in Scotland.
The largest aggregate swing achieved by any party since 1945 was 10.2% by Labour in 1997. The next largest was Mrs Thatcher’s 5.3% swing in 1979. The next highest by Labour was Harold Wilson’s 3.1% in 1964.
The current collapse in the Conservative poll rating has inflated Labour’s poll lead to a level where, even allowing for some Tory recovery, that 14% swing seems to be within reach. But were the Tories to succeed in recovering the support of most of the currently undecided voters and those who have switched to Reform, then it becomes much more difficult.
4. Voting Intention and the Election
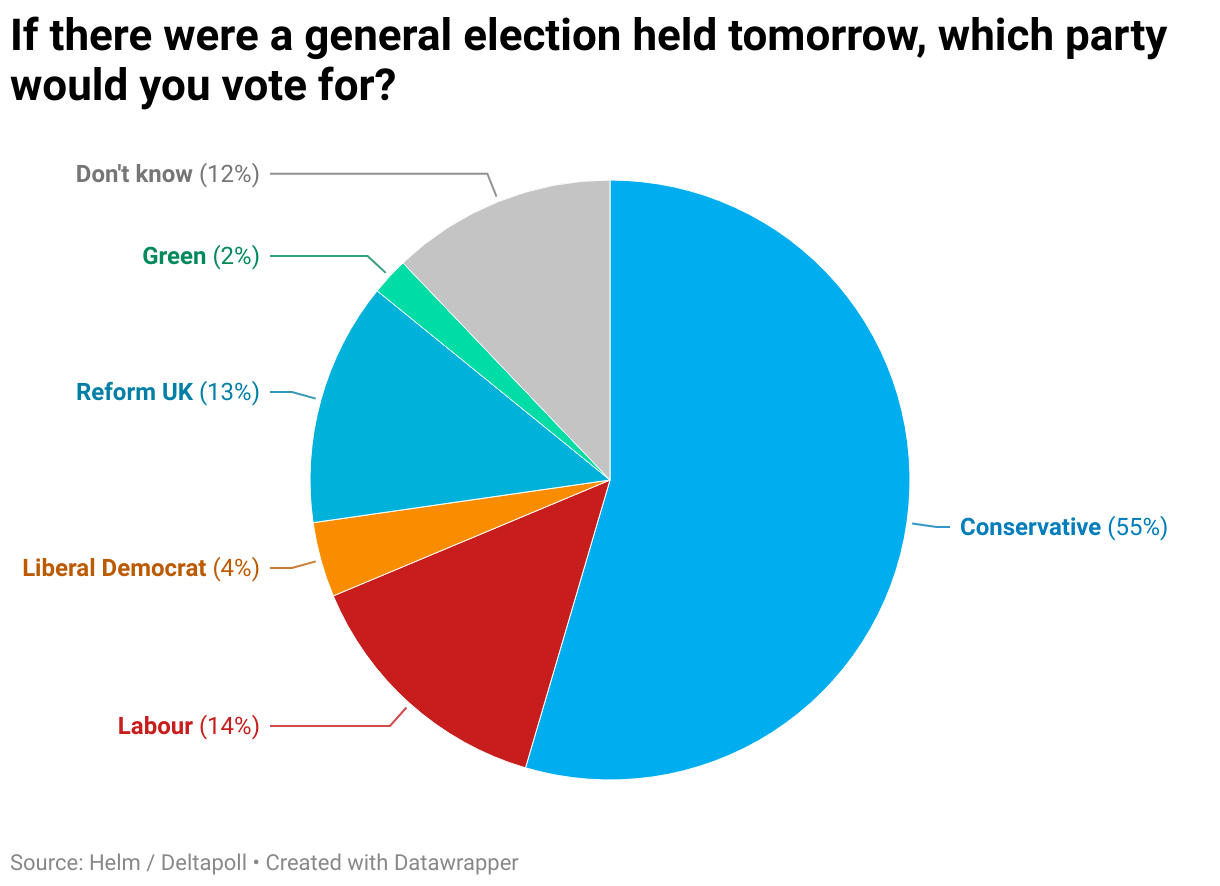
The first wave of the Helm-Deltapoll survey shows that currently 54% of 2019 Conservatives are intending to vote Tory in the general election (referred to from now on as Loyal Tories). That therefore equates to roughly 24% of all voters at the same level of turnout, but a higher percentage if turnout falls. The current Tory average in the polls is approximately 26%.
Some 14% of 2019 Conservatives have switched to Labour, which equates to about 6% of all voters. So, very simplistically, if these voters did indeed switch to Labour in the general election, and there were no other changes, then that would produce a swing of 6% from Conservative to Labour which would almost certainly leave the Tories as the largest party. Of course the real flows of votes between parties are complex, e.g. Labour is benefiting from a net switch of voters from the Liberal Democrats, and the natural turnover of the electorate between elections does not always cancel itself out, but we can take from this that while the level of switching to Labour is significant, it is not sufficient by itself to create the fundamental rebalancing of the electorate which Labour requires for an overall majority, let alone a landslide.
Almost as many 2019 Tories are now backing Reform UK, with 19% of these voters claiming to have voted UKIP at least once between 2010 and 2017 and 11% to have voted Labour in the same period. These numbers are similar to those being shown in other polls and it is a reasonable inference that until recently many of these Reform voters had been undecided. As is usual with support for Reform and its predecessors, its profile is biased towards men and those over the age of 50.
Of the 12% claiming to be undecided as to who they will vote for, 16% claim to have voted Labour at least once between 2010 and 2017, 8% for the Liberal Democrats but only 7% for UKIP.
Figure 1: Current Voting Intention
Overall 55% say that they are fairly sure of which party they will vote for, rising to 70% among Loyal Tories and 68% among those who have switched to Labour. Switchers to Reform are more likely to say that they may change their minds before the election.
The responses to these questions are particularly subjective and may understate the likelihood of churn among these voters.
Table 1: Strength of Current Vote Choice
Just 5%, nearly all of them Loyal Tories, believe that the government has since 2019 done a very good job. However a large proportion are prepared to cut them some slack for their failures. Some 33% believe they have done a good job in difficult circumstances, and another 36% that they have done a poor job but no other party would have done any better. Interestingly 23% of switchers to Labour agree with this statement along with over half of the undecided.
Those with no sympathy for the government’s perceived failures are unsurprisingly concentrated among switchers to Labour (67%) and Reform (45%).
These figures though may provide some encouragement for Sunak as there is clearly mileage in placing the government’s failures and broken promises in the context of the unique challenges of the last five years.
Table 2: Conservative Government Job Performance
Despite showing some sympathy for the government’s difficulties, switchers to Labour are almost wholly committed to their allegiance with over 55% strongly preferring a Labour government to a Conservative one. Otherwise there is virtually no appetite for Prime Minister Keir Starmer among these respondents with just 8% of current Undecideds and 6% of Reform voters (effectively de minimis numbers) having that preference. While 41% of Reform supporters and 45% of Undecideds claim they cannot choose between the parties, that should probably be taken more as an indictment of the Tories than genuinely even-handedness given the overall balance of their responses on policy questions (below).
Figure 2: Preferred Government
5. Conservative Strategy and Message
Respondents were presented with summaries of two alternative sets of priorities for the government which sought broadly to encapsulate the political split within the Conservatives. Of necessity these were broad-brush and crude and could not account for nuances within the respondents’ personal concerns. The concentration on Brexit, immigration and low tax received slightly more support than the economic task, but there was a marked political divide between the responses of those who had defected to Labour and those who had defected to Reform who overwhelmingly preferred the former.
In the next wave of the survey this question will be disaggregated in order to understand whether these are indeed regarded as real choices or packages and whether any of immigration, low taxes or Brexit is by itself more salient than any of the others.
Table 3: Political Priorities
The Conservatives’ default dividing line with Labour concerns Rishi Sunak’s plan and the allegation that Keir Starmer has no plan. Across all respondents there was significant agreement that this is indeed a real difference between the parties, with even 28% of switchers to Labour assenting to it. The question wording stating that this is a Conservative message would inevitably boost its attraction to Loyal Tories but Sunak may be heartened that its reach appears to stretch to more disaffected ex-Tory voters as well.
Figure 3: Conservative Message
Sunak has also sought to present himself as an “Agent of Change”, despite being the leader of the Conservative Party. Most leaders, regardless of their political philosophy, seek the mantle of the “Change” candidate, but to what extent do the supporters of the Conservative Party which seeks to uphold traditional values actually desire change and how do they define it?
The poll presented three definitions of change with the plurality preferring “Some change of policy, but sticking with traditions and the established ways of doing things as a country”; much the preferred choice of Loyal Tories. But well ahead among switchers to both Labour and Reform was “A complete change of direction for the country, with new policies and a willingness to do things differently”. We can assume that the nature of that change would differ markedly between the two switcher groups, but it does suggest that the traumas of the last four years have bred an appetite for radicalism of whatever sort.
Table 4: The Desire for Change
Keir Starmer may be reassured that the profile of what change Labour might bring was similar to the overall pattern of preferences described. Certainly there is little evidence here that a Starmer government would represent more of the same with a different label. Among switchers to Labour the balance of view was that he would indeed bring that complete change of direction, while Reform switchers who seek a different kind of change, are less convinced. Around one in three of Loyal Tories, switchers to Reform and Undecideds were unable to answer the question.
Table 5: Would Labour Bring Change?
6. Leaders
Any leader of a party as unpopular as the Conservatives is bound to be held personally responsible to at least some extent. But would anyone else perform any better?
The poll presented a list of potential alternative Tory leaders (including some like David Cameron and Liz Truss who are effectively hypothetical) and asked separately for each whether under them the Conservatives would have a better or worse chance of winning the general election. Note they were not being asked who their personal preference might be, but to make an assessment of the wider appeal which they might have.
Respondents were not offered the alternative of “Make No Difference”, which given the Tories’ plight would probably be much the most obvious answer, in order to force a choice.
With the exception of Penny Mordaunt, all those offered were regarded as on balance likely to worsen the Tories’ prospects, with Mordaunt having a 38%-31% positive margin. Among the leading realistic contenders, Kemi Badenoch had a net negative rating of 20% with 45% unable to offer an opinion.
Mordaunt’s relative asset is that she is the only one of the candidates presented who appears to straddle the divide within the Conservative Party. Among Loyal Tories and switchers to Labour, David Cameron is regarded as having more appeal, but he, along with Jeremy Hunt, scores very badly with switchers to Reform. Braverman does even better than Mordaunt among Reform switchers, but Loyal Tories and Labour switchers rate her very negatively.
Figure 4: A Change of Leader?
Figure 5: Percentage believing each would improve the Conservatives' chances of winning the general election by current party support
7. Policies
Respondents were asked whether across a number of policy challenges, Labour would be likely to do a better or worse job than the Conservatives. Given the political balance of the sample it would seem very unlikely that the plurality would believe Labour would do better on any of them whatever the weaknesses of the Tories, but by 43%-36% that was the perception on “Looking after the poorest in society”. There was much more scepticism on Labour’s other traditional strength “Cutting NHS waiting lists” where by 43%-31% it was believed Labour would do a worse job than the Tories.
The concern for Starmer would be that Labour’s Achilles’ heel in respect of economic competence still has some traction. Despite the efforts of Rachel Reeves, Labour scores worst on managing the economy and public spending (perhaps exacerbated by the fieldwork taking place during the row over green investment), along with stopping the small boats. Perhaps more surprisingly the rating on taxation is not too bad, perhaps a function of the wording which refers to the “fairest” level, fairness often being perceived to be a Labour value.
Among switchers to Labour the party has a resounding endorsement with figures well over 50% believing Labour would do a better job on every policy area with the exception of “Looking after the interests of motorists”, which will be of particular interest to the Tories in their quest for a populist message of the sort which worked for them in the Uxbridge & South Ruislip by-election.
The Tories should though be concerned that among Loyal Tories and Undecided voters a solid minority of respondents believed Labour would do a better job in respect of each policy area, which may indicate that there are further potential switchers.
Figure 6: Labour Policy Performance Expectations
Figure 7: Percentage believing Labour would do a better job by current party choice
Respondents were offered a number of potential budget measures and asked to choose up to three which they believed should be the priority.
The high ratings for cutting income tax are to be expected as it is the most easily understood and has the widest salience and likely to be among the top three preferences of voters of any political complexion. Of most interest is the relatively low score across the board but especially among Reform switchers for cutting inheritance tax which reflects the fact that this is a relatively working class segment of the Tory 2019 coalition. Among this group cutting income tax and taxes on businesses do well and increasing public spending does relatively badly, which may be a function of the preponderance of the self-employed and small traders among them.
The preferences of the switchers to Labour are almost diametrically opposed to those of the Reform switchers, including the only pocket of support for extending Child Benefit, a microcosm of the political dilemmas which Sunak must resolve in repairing the Tory coalition.
Table 6: Budget priorities